
The renewable energy sector is experiencing unprecedented growth in 2026, with global installed capacity reaching record levels and market dynamics shifting faster than policy frameworks can adapt. For professionals tracking this transformation, the challenge isn’t finding information but interpreting which developments signal genuine structural change versus temporary market fluctuations.
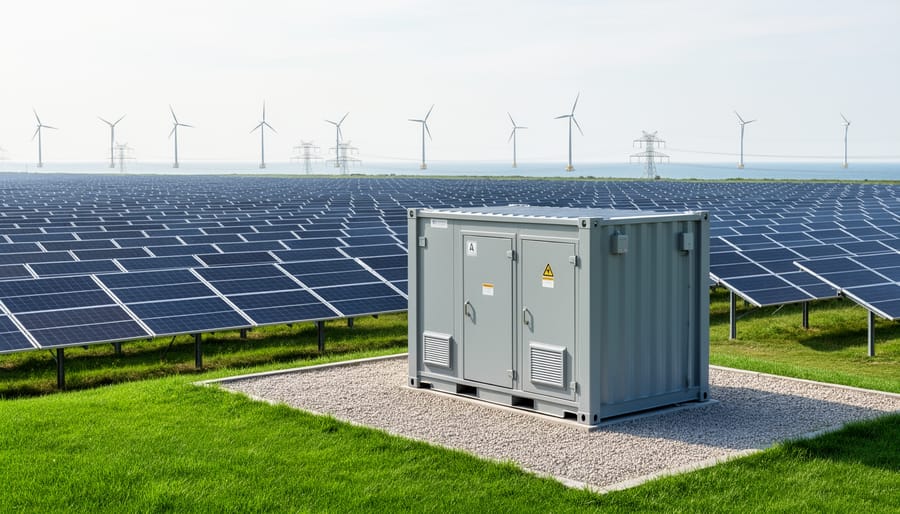
Current data shows renewable energy installations continue to accelerate across all major technologies, though the distribution reveals critical regional and technological disparities. Solar photovoltaic capacity remains the dominant growth driver, particularly in utility-scale deployments, while offshore wind projects are finally delivering on years of projected expansion. Energy storage integration has moved from experimental to essential, fundamentally altering how grid operators manage intermittency and baseload requirements.
Three factors define the 2026 landscape: corporate procurement agreements that now rival government incentives in driving deployment, supply chain consolidation that’s reshaping manufacturing economics, and grid infrastructure constraints that increasingly determine where capacity can be added regardless of resource availability. The gap between announced projects and operational capacity has widened, making it essential to distinguish between press releases and actual commissioning dates.
This analysis breaks down the verified capacity additions, examines the technologies gaining genuine market traction, and identifies the regions where policy, finance, and infrastructure have aligned to create sustained momentum. Understanding these patterns matters because the decisions being made today determine which countries and companies will control the clean energy economy for the next decade.
The Numbers Behind 2026’s Green Energy Boom
The United States energy sector is experiencing its most ambitious expansion year on record. According to the Energy Information Administration’s February 2026 report, developers have planned 86 GW additions in 2026 representing a 62% jump from the 53 GW actually added to the grid in 2025. This acceleration isn’t just about raw numbers, it signals a fundamental reshaping of America’s electricity infrastructure.
The breakdown reveals where the industry is placing its bets:
| Technology | Planned Capacity (GW) | Share of Total | 2025 Comparison |
|---|---|---|---|
| Solar | 43.4 | 51% | Significant increase |
| Battery Storage | 24.1 | 28% | Major expansion |
| Wind | 12.0 | 14% | Modest growth |
| Natural Gas | 6.5 | 7% | Declining share |
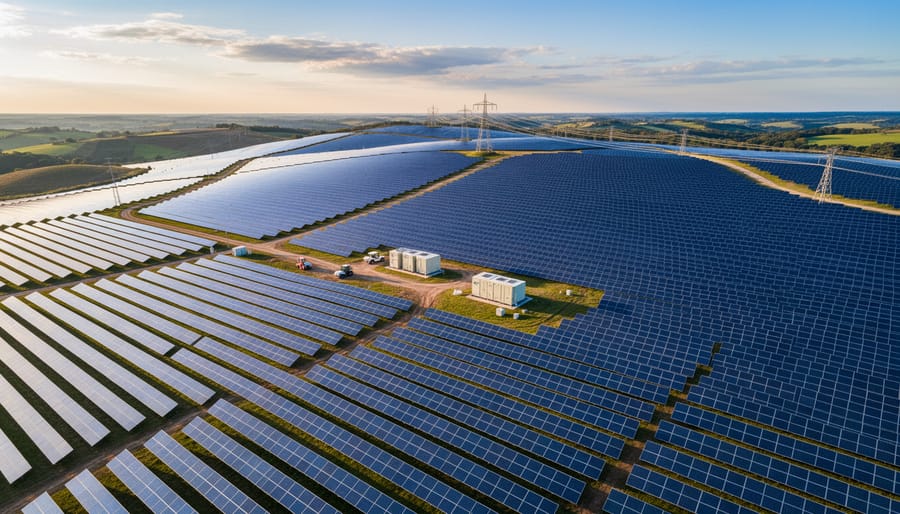
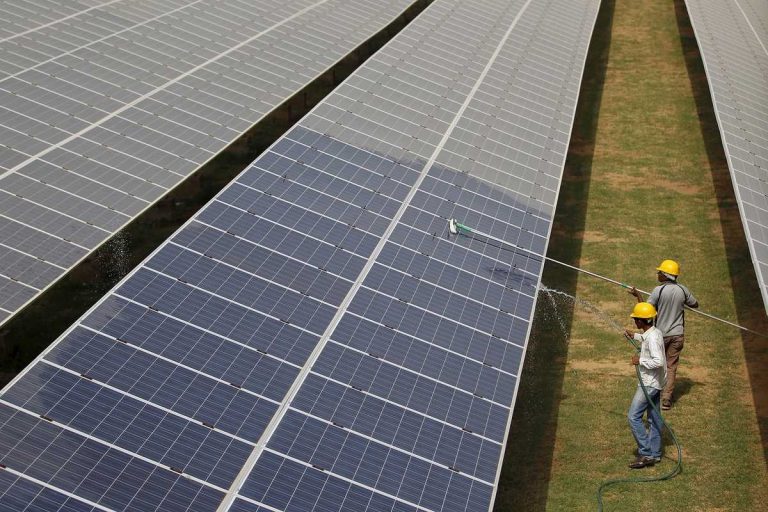
What stands out immediately is solar’s dominance. With solar is 51% of planned additions, photovoltaic projects now command over half of all new capacity. That’s 43.4 GW, roughly equivalent to the entire grid capacity of a mid-sized European nation.
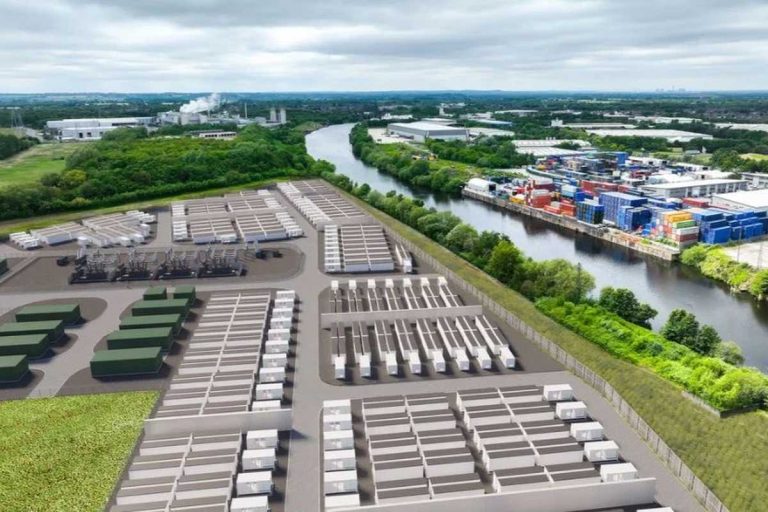
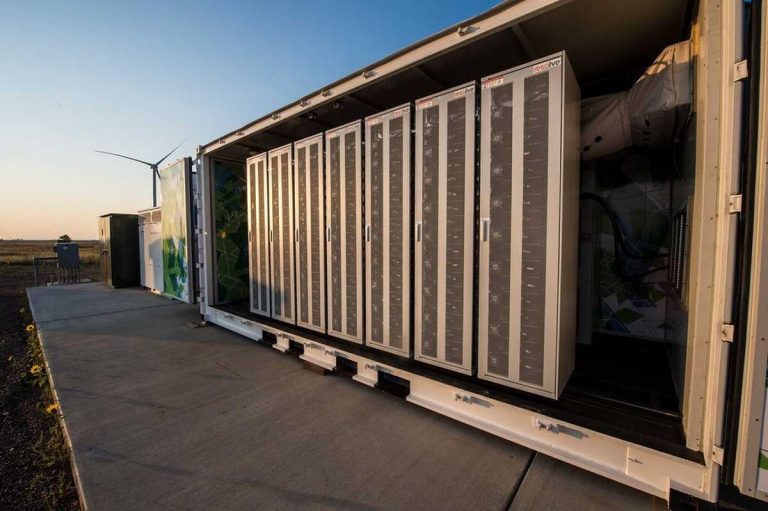
Battery storage’s 28% share deserves equal attention. At 24.1 GW, storage capacity is no longer a supporting player but a central pillar of grid planning. This reflects developers’ understanding that renewable expansion without storage creates grid management headaches. The pairing of generation and storage in single projects has become standard practice, not an optional add-on.
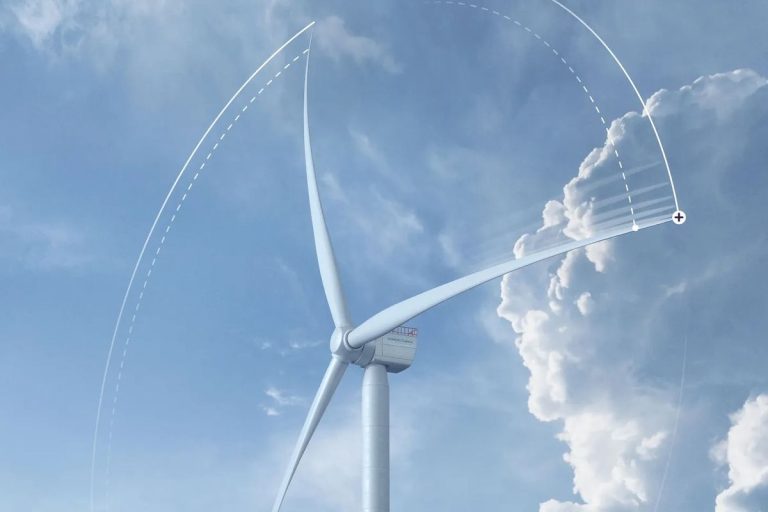
Wind’s 14% share, translating to 12 GW, tells a different story. While still substantial, wind is growing more cautiously compared to its solar counterpart. This reflects regional constraints, longer development timelines, and in some markets, community resistance that has slowed permitting.
The combined renewable and storage portion, 93% of planned additions, pushes fossil fuel generation to the margins of new development. Natural gas accounts for just 6.5 GW, with coal additions effectively nonexistent. This isn’t activism driving the shift; it’s economics. Solar and wind projects backed by storage can now compete directly with gas on both price and reliability, fundamentally altering investment decisions across the sector.
Solar Power’s Dominance: Why Half of All New Capacity Is Photovoltaic
Regional Powerhouses: Where Solar Growth Is Concentrated
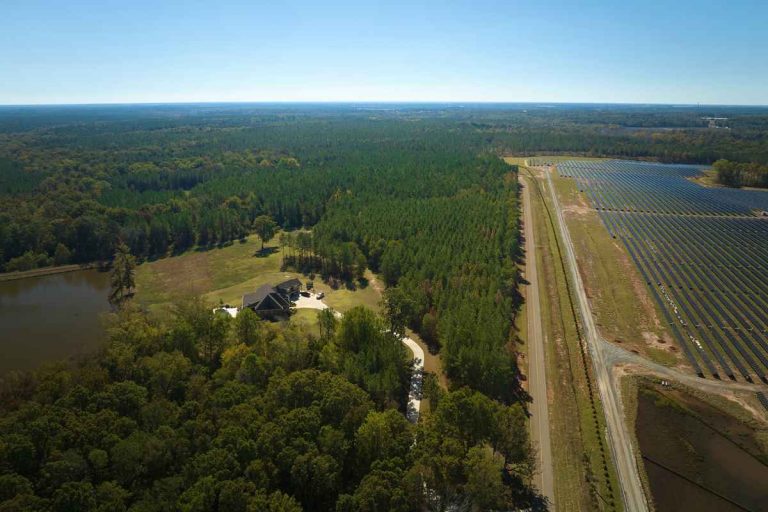
Four states are capturing more than half of 2026’s solar expansion, and their dominance reveals the complex interplay of geography, policy, and infrastructure that determines where renewable energy takes root.
Texas leads the charge with massive projects like the Tehuacana Creek 1 Solar and BESS facility, which will add 837 MW of solar photovoltaic capacity this year. The state’s advantage is straightforward: abundant land, exceptional solar irradiance, and deregulated electricity markets that reward competitive pricing. Texas also benefits from existing transmission infrastructure built for its oil and gas industry, making it cheaper to connect large solar arrays to the grid. The concentration of development here isn’t just about sunshine, it’s about economics and logistics working in tandem.
Arizona’s position makes intuitive sense given its desert climate and year-round solar potential. The state offers some of the highest capacity factors in the nation, meaning solar panels generate closer to their maximum output more consistently than in cloudier regions. This translates directly to better returns on investment for developers.
California’s continued solar growth, despite already having substantial capacity installed, reflects both ambitious renewable portfolio standards and the state’s role as a testing ground for grid integration technologies. Michigan’s inclusion on this list is less obvious but significant, it demonstrates that solar economics now work even in states without Arizona’s climate advantages, driven by falling equipment costs and improving panel efficiency in diffuse light conditions.
This regional concentration creates both opportunities and challenges. Supply chains, skilled labor, and grid infrastructure are all scaling to meet demand in these four states, which could accelerate project timelines but also risks creating bottlenecks that slow deployment elsewhere.
Battery Storage’s Critical Role in the Green Energy Transition
Battery storage’s 28% share of planned 2026 capacity additions, translating to roughly 24 gigawatts, reflects a fundamental shift in how the energy sector approaches renewable deployment. This isn’t auxiliary infrastructure anymore; storage has become a primary investment category, nearly matching wind’s contribution and representing a critical enabler for the solar and wind capacity coming online. The investment surge addresses a basic physics problem: solar panels produce electricity when the sun shines, wind turbines generate when air moves, but grid demand peaks don’t always align with these natural cycles. Without storage, utilities either curtail renewable generation during low-demand periods or rely on fossil fuel plants to cover gaps when renewables drop off.
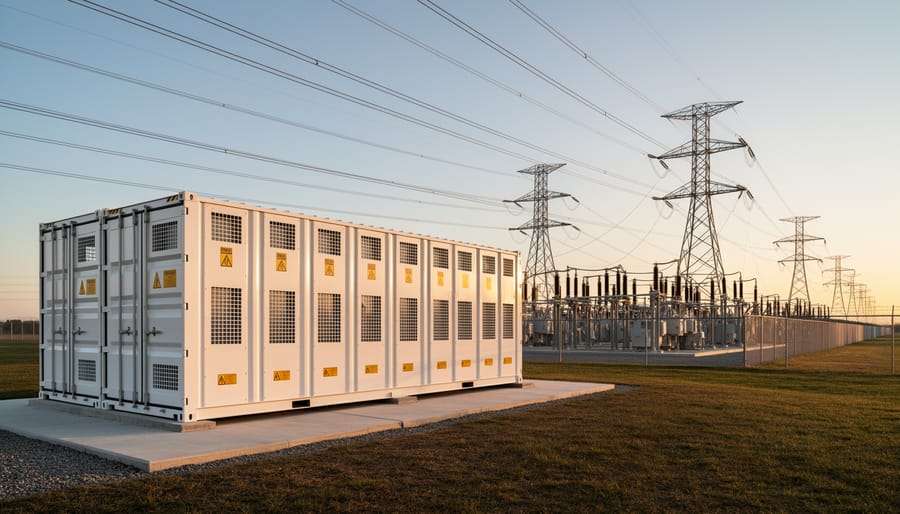
The grid stability benefits extend beyond simple time-shifting. Large-scale battery installations provide frequency regulation, voltage support, and rapid response to sudden demand spikes or generation losses, services traditionally handled by spinning reserves from natural gas peakers. A 200 MW battery system can ramp from zero to full discharge in milliseconds, far faster than any combustion turbine. This responsiveness becomes essential as grids incorporate higher renewable penetration levels; California’s 2025 experience showed battery systems stepping in during evening demand peaks when solar production fell, preventing what would have been grid stress events just five years earlier.
The symbiotic relationship between solar development and battery deployment is particularly evident in the project pipeline. Many of the largest solar installations planned for 2026 include co-located storage, recognizing that a solar-plus-storage facility can sell electricity during high-value evening hours rather than just midday when solar saturation often depresses wholesale prices. This pairing improves project returns while delivering dispatchable clean energy, addressing the intermittency criticism that has long challenged renewable expansion. Wind farms increasingly follow this model too, pairing turbines with batteries to smooth output variability and capture price arbitrage opportunities.
From a sector perspective, the storage buildout creates distinct opportunities and challenges. Manufacturing capacity for lithium-ion cells, power electronics, and thermal management systems faces strain from demand growth. Utility procurement teams now evaluate storage vendors alongside turbine and panel suppliers, while grid operators update dispatch algorithms to optimize battery cycling. Workforce development needs have expanded beyond solar installers and wind technicians to include battery system integrators, energy management software specialists, and storage asset managers. The 2026 capacity additions signal that energy storage has graduated from niche technology to core infrastructure, fundamentally reshaping how renewable energy integrates into the grid.
What This Means for the Renewable Energy Sector
The 86 GW pipeline for 2026 represents more than numbers on a spreadsheet. It signals a fundamental shift in how the energy sector operates, and professionals across the value chain need to prepare for what comes next.
Supply chains face immediate pressure. Manufacturing 43.4 GW of solar panels, plus the inverters, racking systems, and balance-of-system components they require, demands coordination across global production networks. Battery storage projects need lithium, cobalt, and other critical minerals at unprecedented scale. Companies that secure supply agreements now and build resilient procurement strategies will have competitive advantages as projects race toward completion dates.
The workforce gap looms large. Installing and maintaining this much new capacity requires electricians, technicians, engineers, and project managers trained in renewable technologies. The solar installations concentrated in Texas, Arizona, California, and Michigan alone will create thousands of construction jobs, followed by permanent operations positions. Trade schools, community colleges, and apprenticeship programs that align curricula with industry needs will help determine whether projects stay on schedule or face costly delays.
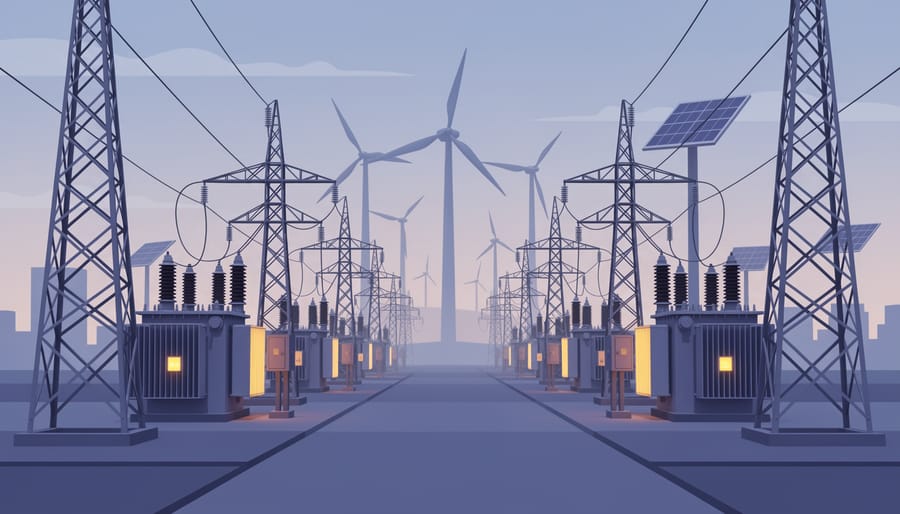
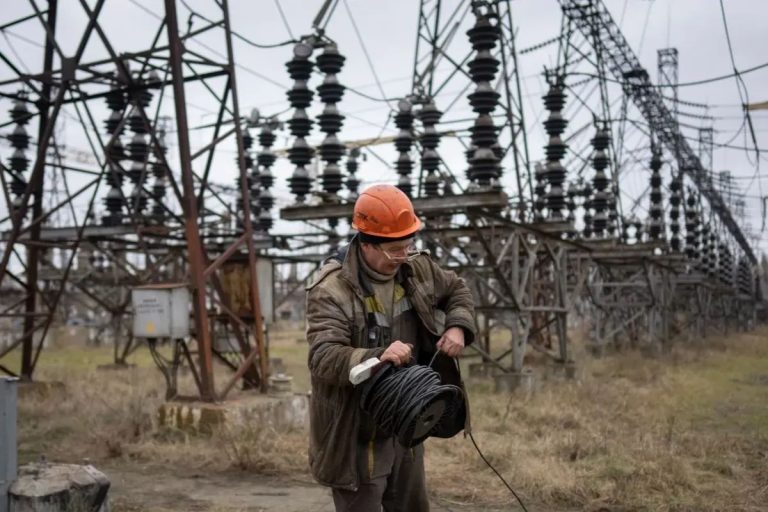
Grid infrastructure presents both challenge and opportunity. Integrating 86 GW of new capacity tests transmission systems, distribution networks, and grid management capabilities. Utilities must upgrade substations, reinforce transmission lines, and deploy sophisticated control systems that can handle bidirectional power flows and variable generation. For equipment manufacturers and engineering firms, this infrastructure buildout represents a multibillion-dollar market extending well beyond 2026.
Investors should watch how projects progress from planned to operational status. The gap between announced capacity and what actually comes online reveals market realities. Developers who navigate interconnection queues efficiently, secure financing on favorable terms, and execute construction on schedule will shape industry standards. Those dynamics will define which companies and regions lead the next phase of the energy transition.
The 86 gigawatts of planned capacity additions for 2026 represent more than just impressive statistics. They signal an accelerating transformation of America’s energy infrastructure, with solar and battery storage leading a fundamental shift in how we generate and deliver electricity. For renewable energy professionals, the implications extend across every facet of the sector: from supply chain logistics and workforce planning to grid integration strategies and investment opportunities.
As these projects move from planning to construction and operation throughout 2026, several factors warrant close attention. The concentration of solar development in specific regions will test transmission infrastructure and interconnection processes. The substantial battery storage buildout will provide real-world data on large-scale grid integration. The industry’s ability to execute on this ambitious pipeline while managing material costs, skilled labor availability, and regulatory timelines will shape the trajectory for years ahead.
NewEnergy Now remains committed to tracking these developments as they unfold, providing the detailed analysis and verified data that renewable energy professionals need to navigate this pivotal period in the energy transition.


+ There are no comments
Add yours